I have a problem to distinguish between a complete noisy data or data containing some outliers. In fact, I am trying to do a sort of Grid Independence Check (term usually is used in Computational Fluid Dynamics to identify the greed size where the numerical results are independent from the grid/network size) for my data set. I introduced this term only to better explain my case: I have a model which outputs a set of numerical data. Changing the step size in the model, increases the size of output numerical result (obviously). However, the output results contain noisy data which should be removed prior to the check for grid independence (or step size independence). An example output from the model can be similar to the following image.
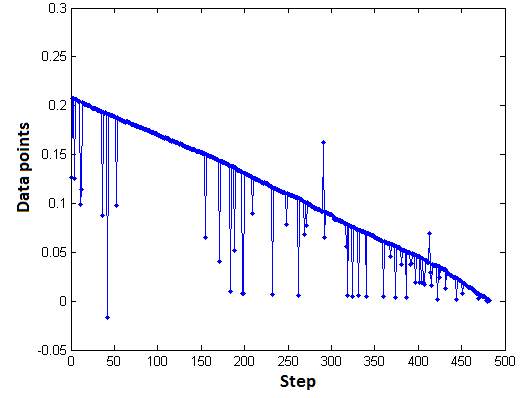
These output data points are "independent" from the step size, because the overall data (after removing the outliers) follow a linear relation independent of the steps. However, this can be detected after removal of outlier points (if not a robust criteria to check the linear relation for various step sizes would not be available; here, I use Pearson/Spearman correlations). Removing outliers from the data set shown above, can be achieved by employing MATLAB built-in function stdfilt() or simply:
rmvIdx = (abs(DataPoints- median(DataPoints)) > N*mad(DataPoints));
DataPoints(rmvIdx) = [];
Nevertheless, both the approaches miss some data points, and cannot "completely" detect outliers. Therefore, my first question is: how to fully detect outliers in the depicted image. I followed several variations to fully detect the outliers, e.g.:
% First remove distant outliers with N = 3
 rmvIdx = (abs(DataPoints- median(DataPoints)) > N*mad(DataPoints));
 DataPoints(rmvIdx) = [];

% Remove using local SD
Local_std = stdfilt(DataPoints);
Local_std(abs(Local_std- mode(Local_std)) < 1e-4) = 0;
DataPoints(Local_std) = [];

% Smoothing data as a further step
DataPoints= smooth(DataPoints,0.6);
The above approach will find more outliers, however this "strict" search of outliers may cause issue with other data sets, such as:
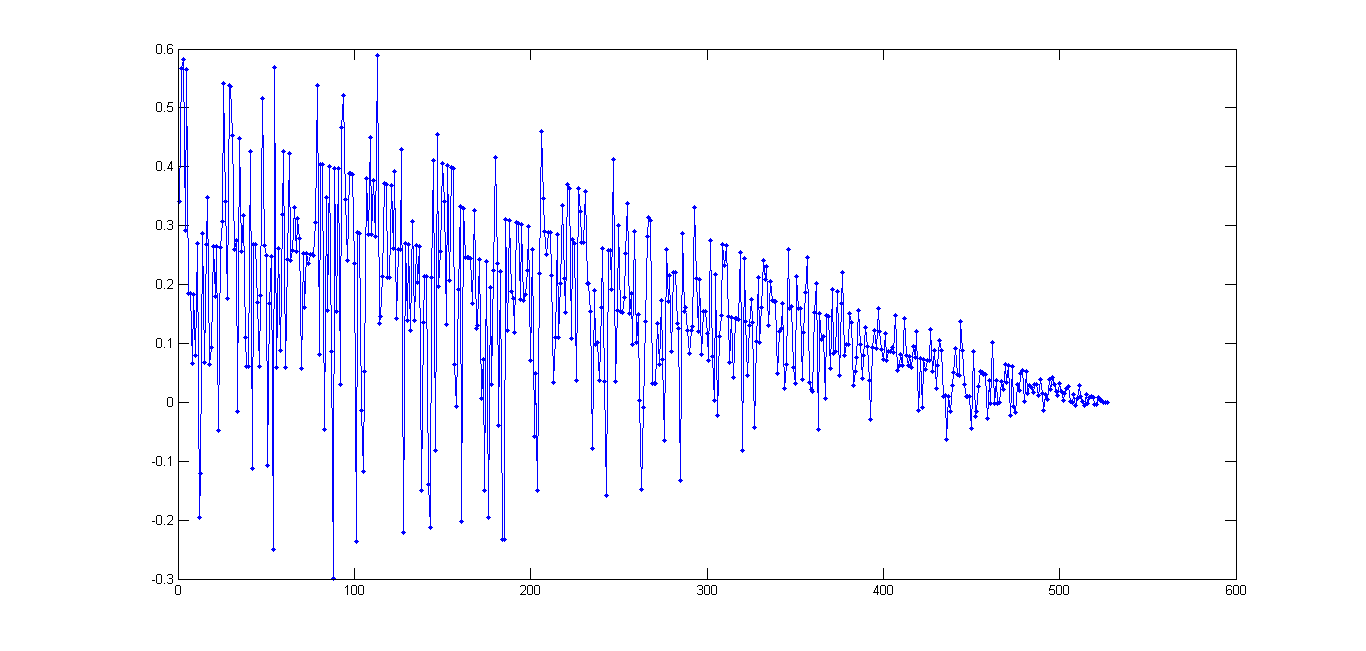
As shown, this set of data is "completely noisy" (compared to the previous image); however, when using the above-mentioned approach to detect outliers, it will erroneously detect linear relationship (Spearman/Spearman R > 0.9-0.99) for small step sizes (simply because in small step sizes noisy data may be damped by the approach I took). Thus the second questions is: how to detect completely noisy data sets, specially when I used that "strict" approach to find outliers? how to trade-off between these different but highly dependent cases?
NOTE:-
Matlabsolutions.com provide latest MatLab Homework Help,MatLab Assignment Help for students, engineers and researchers in Multiple Branches like ECE, EEE, CSE, Mechanical, Civil with 100% output.Matlab Code for B.E, B.Tech,M.E,M.Tech, Ph.D. Scholars with 100% privacy guaranteed. Get MATLAB projects with source code for your learning and research.
Outliers are rare events, that do not follow the same distribution as the regular noise in your data. You can think of data with low noise, plus some outliers as a mixture distribution, thus most of the time, you get the base (small) noise, but some of the time, you get an outlier in there.
So the first curve has outliers in it, almost too many to be considered rare, but I will concede they can be called outliers. The second curve is just heavily corrupted with large noise. The outliers are the noise there. Outlier detection/correction schemes will fail on the second curve, since it is all outliers.
Next, the second curve appears to have heteroscedastic noise. The noise does not have the same noise parameters along the curve, with a standard deviation that appears to be roughly proportional to the signal. The noise also appears to come from a distribution that is not a continuous one. Only discrete levels seem to arise.
I also notice that most of your outliers seem to lie on the low side of that curve, but not all of them. A good scheme will take this fact into account.
Schemes to detect outliers perfectly will be rare and hard to come by. In fact, you will never find a perfect scheme to do so. And the latter mess of a curve you show will never be easily fit very well.
SEE COMPLETE ANSWER CLICK THE LINK
Comments
Post a Comment