How can I plot this state space like the graph I attached by using tf() and step() command? Thank you! I2/E0=1/(s^3+s^2+3*s+1) NOTE:- Matlabsolutions.com provide latest MatLab Homework Help, MatLab Assignment Help , Finance Assignment Help for students, engineers and researchers in Multiple Branches like ECE, EEE, CSE, Mechanical, Civil with 100% output.Matlab Code for B.E, B.Tech,M.E,M.Tech, Ph.D. Scholars with 100% privacy guaranteed. Get MATLAB projects with source code for your learning and research. Try these codes below please; clc; clear; close all; numerator = 1; denominator = [1,1,3,1]; sys = tf(numerator,denominator); yyaxis left SEE COMPLETE ANSWER CLICK THE LINK https://www.matlabsolutions.com/resources/how-to-plot-transfer-functions-in-matlab-.php
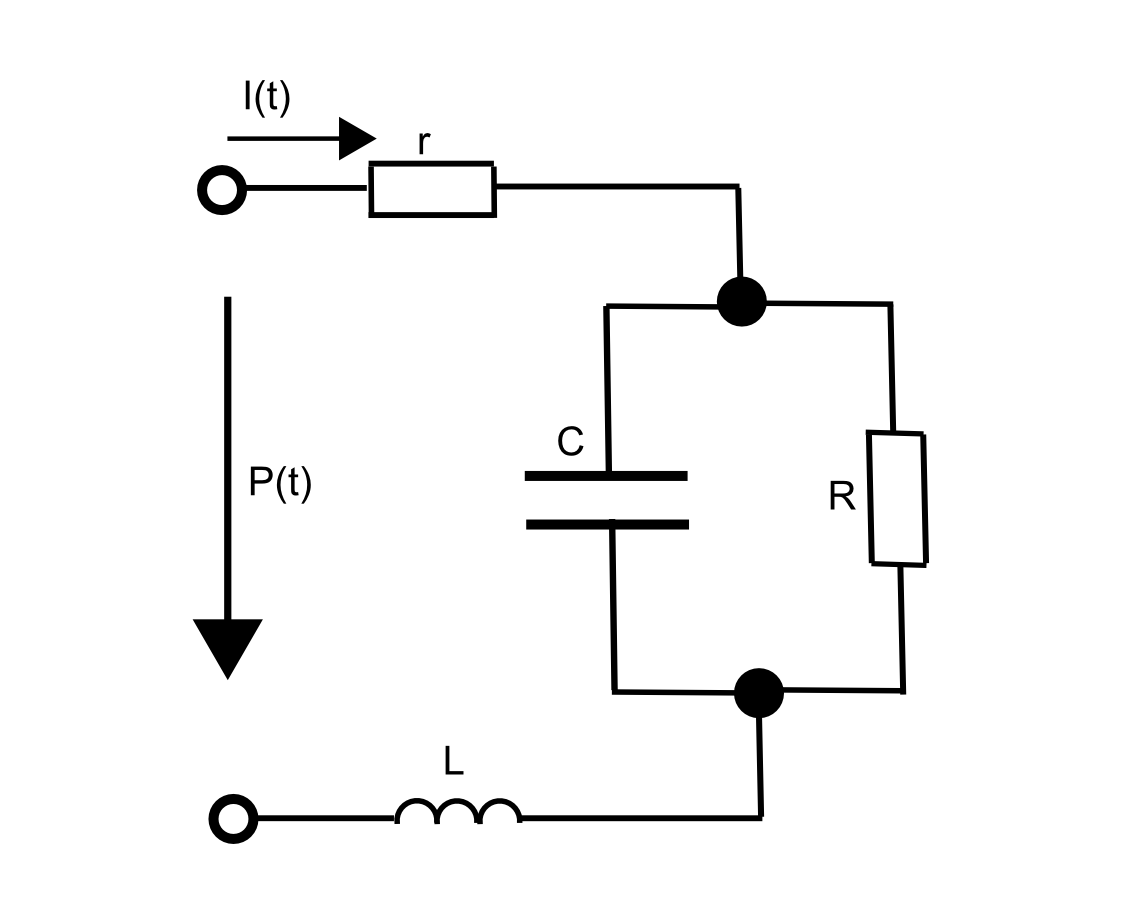
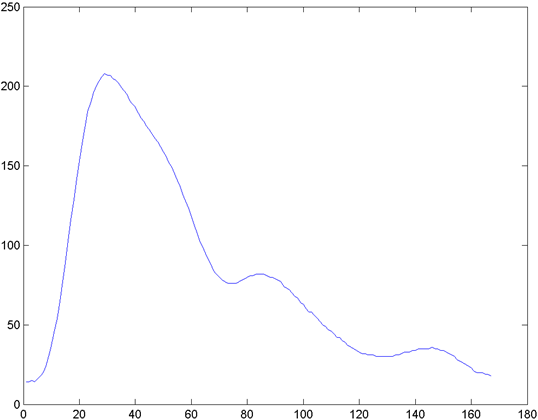
Hello, I would like to know if there is any way how to identify parameters if I have specified input to model and desired output. To be more specific I am modelling Windkessel model. It´s electrical model from two resistors one inductor and one capacitor. Wanted output is pulse wave.
Model:
And this is desired output of model (voltage at resistor R):
Can anyone help me please? Thank you
NOTE:-
Matlabsolutions.com provide latest MatLab Homework Help,MatLab Assignment Help for students, engineers and researchers in Multiple Branches like ECE, EEE, CSE, Mechanical, Civil with 100% output.Matlab Code for B.E, B.Tech,M.E,M.Tech, Ph.D. Scholars with 100% privacy guaranteed. Get MATLAB projects with source code for your learning and research.
If you provide the input and output as a ‘.mat’ file, and your model, it should be possible to derive the component values. (I can derive a circuit model for it if you want.)
You aren’t doing system identification since you already have a model for your system. You’re doing parameter estimation of your model.
EDIT —
The circuit model I derived for your model (I let the Symbolic Math Toolbox do the algebra) is:
syms C L R r Pi Po P2 s t
Z1 = 1/r;
Z2 = s*C + 1/R;
Z3 = 1/(s*L);
Zt = Z1 + Z2 + Z3;

I = Pi/Zt;
Po = Z2*I;
Out = ilaplace(partfrac(Po, s));
Out = simplify(Out, 'Steps',20);
Out_fcn = matlabFunction(Out, 'Vars',{t,Pi,r,C,R,L})

Out_fcn = @(t,Pi,r,C,R,L) Pi.*dirac(t)-(Pi.*exp((t.*(R+r).*(-1.0./2.0))./(C.*R.*r)).*(cosh((1.0./sqrt(L).*t.*sqrt(L.*R.^2+L.*r.^2-C.*R.^2.*r.^2.*4.0+L.*R.*r.*2.0).*(1.0./2.0))./(C.*R.*r))-1.0./sqrt(L).*sinh((1.0./sqrt(L).*t.*sqrt(L.*R.^2+L.*r.^2-C.*R.^2.*r.^2.*4.0+L.*R.*r.*2.0).*(1.0./2.0))./(C.*R.*r)).*(L.*r+L.*R-C.*R.*r.^2.*2.0).*1.0./sqrt(L.*R.^2+L.*r.^2-C.*R.^2.*r.^2.*4.0+L.*R.*r.*2.0)))./(C.*r);
The ‘Z’ values are the three lumped impedances (and ‘Zt’, the total impedance), where the output is taken across ‘Z2’.
The idea is straightforward: the current ‘I’ (or blood flow here) through the series of impedances is simply ‘Pi/Zt’. It is then straightforward to calculate the voltage (or pressure) drop across ‘Z2’ as ‘Z2*I’.
In order to fit your function and estimate the parameters, we need three data vectors: ‘t’, ‘Pi’, and ‘Po’, the time, input pressure with respect to time, and output pressure with respect to time. The function fits the output pressure it estimates with specific parameters to the ‘Po’ vector.
SEE COMPLETE ANSWER CLICK THE LINK
Comments
Post a Comment