Welcome to top Matlab Articles Provider in World. We are a team of Matlab Experts available online 24x7. Get help in your Matlab Projects. matlabsolutions.com
Looking for inspiring MATLAB projects to sharpen your skills or impress in your next assignment? At MATLABSolutions.com , we’ve curated the top 12 MATLAB projects that showcase the power of MATLAB in signal processing, image analysis, machine learning, and more. These hands-on examples, complete with code and explanations, are perfect for beginners and advanced users alike. Dive in and explore the best MATLAB projects to elevate your expertise! Signal Smoothing with Moving Average Filter Master signal processing by smoothing noisy data using MATLAB’s movmean function. This project cleans a synthetic sine wave, teaching you noise reduction basics. Ideal for audio or sensor data analysis. Get the code at MATLABSolutions Projects Image Edge Detection Using Canny Filter Explore image processing with MATLAB’s Canny edge detection algorithm. This project highlights edges in any photo, perfect for computer vision applications. Download the script and try it on your own images! Bitcoin Price ...
How can I use Matlab to evaluate ∫10∫10∫101(xyz)xyz dx dy dz?
I was struggling with my MATLAB Assignment help and then a good friend told me about MatlabSolutions.com website and they gave me the best Assignment help ever. I hope to always count on the quality and efficiency of your services.
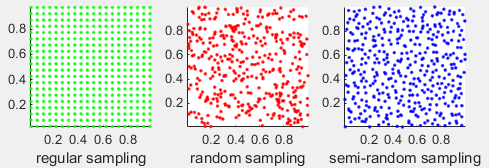
Numerical approach: sample Two methods have been suggested here for the numerical approach, regular sampling and random sampling. In many cases, however, semi-random sampling has superior convergence.
The problem of regular grid sampling, is that you sample at fixed spatial frequencies, risking under/oversampling of important frequencies.
The problem of random sampling, is that you could easily under/oversample important regions by chance.
A better approach is semi-random sampling, in which the sampled points are globally more uniformly distributed. In this example, I chose to sample near each point in the regular grid, however, the relative distance to this gridpoint was varied. In each dimension I randomly selected the deviation from the a uniform distribution on the interval [-1/2*d, 1/2*d] in which d is the distance between the regular gridpoints.
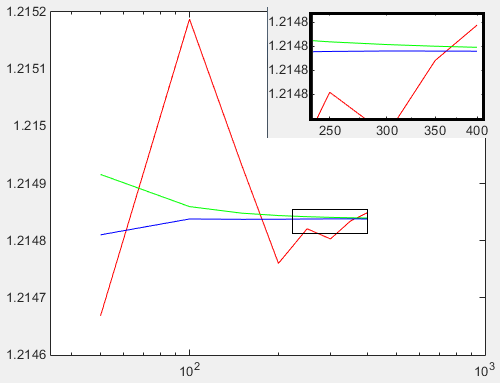
In the figure below it is seen how semi-random sampling (blue line) converges faster than random sampling (red line) or regular sampling (green line).
Semi random sampling (blue line) converges faster than random sampling (red line) or regular sampling (green line). The horizontal axis (N) represents the number of gridpoints in each dimension, leading to N³ sampled points. (Also N³ samples for random sampling).
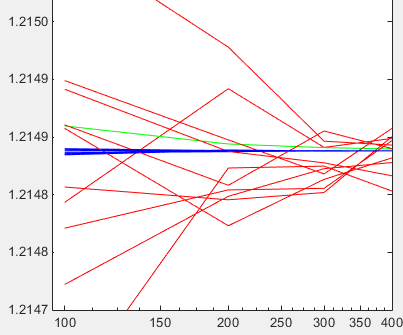
Same figure, but now for ten simulations. %% MATLAB CODE: Nseries = 50:50:400; results = zeros(3, length(Nseries)); for m = 1:length(Nseries)
N = Nseries(m);
% Random sampling xyz = rand(1,N³).*rand(1,N³).*rand(1,N³); results(1, m) = mean(1./xyz.^xyz);
% on exact grid nodes: xyz = x(:).*y(:).*z(:); results(2, m) = mean(1./xyz.^xyz);
% near grid nodes, random deviation: x = x + (rand(size(x))-0.5)/N; y = y + (rand(size(x))-0.5)/N; z = z + (rand(size(x))-0.5)/N; xyz = x(:).*y(:).*z(:); results(3, m) = mean(1./xyz.^xyz); end
Looking for inspiring MATLAB projects to sharpen your skills or impress in your next assignment? At MATLABSolutions.com , we’ve curated the top 12 MATLAB projects that showcase the power of MATLAB in signal processing, image analysis, machine learning, and more. These hands-on examples, complete with code and explanations, are perfect for beginners and advanced users alike. Dive in and explore the best MATLAB projects to elevate your expertise! Signal Smoothing with Moving Average Filter Master signal processing by smoothing noisy data using MATLAB’s movmean function. This project cleans a synthetic sine wave, teaching you noise reduction basics. Ideal for audio or sensor data analysis. Get the code at MATLABSolutions Projects Image Edge Detection Using Canny Filter Explore image processing with MATLAB’s Canny edge detection algorithm. This project highlights edges in any photo, perfect for computer vision applications. Download the script and try it on your own images! Bitcoin Price ...
I have a 1x12 cell in Matlab and each element of this cell has a 3d matrix. I want to make the mean of these 3d matrices, so that I obtain a 3d matrix that has the same dimensions of each one of the 3d matrices of the cell and that is the mean of the 12 3d matrices. How can I do this operation ? I tried to extract each cell and create a 4d matrix so that I could do mean(fourdmatrix,4) . However, it seems not possible to create a 4d matrix. Ideed, a code like this: cell={threedmatrixA, threedmatrixB, ...} fourdmatrix=[]; for i=1:12 fourdmatrix(i)=cell{i}; end does not work. How can I do it ? NOTE:- Matlabsolutions.com provide latest MatLab Homework Help, MatLab Assignment Help , Finance Assignment Help for students, engineers and researchers in Multiple Branches like ECE, EEE, CSE, Mechanical, Civil with 100% output.Matlab Code for B.E, B.Tech,M.E,M.Tech, Ph.D. Scholars with 100% privacy guaranteed. Get MATLAB projec...
PID tuning to meet conditions for settling time and overshoot while a stable system with minimum peak time and zero velocity error. So I am trying to find the gain values for a PI control system that would give me a settling time not exceeding 6 seconds, and an maximum overshoot not going over 5% while ensuring that the peaktime is the lowest it can be, and that the system is stable, and also has zero velocity error. I have written the following code. Starting with a kp and ki value of 1 each, I get a system that gives desirable overshoot and settling time, but I am wondering if the peaktime can be even lower while still having settling time <= 6 and overshoot <= 5. I am using the following toolboxes: Control System Toolbox Questions Using the rlocus function, I have also shown that the real parts of the poles are negative, so this demonstrates that my system is stable right? Also am I using Lsim correctly to determine if velocity error is zero? The resultant graph has a gr...
Comments
Post a Comment